How a Python Expert Solved Vertex Cover with GA + WoC
Contents · 18 sections
- The assignment started with a choice
- Project snapshot
- The graph became a set of decisions
- The fitness function encoded the trade-off
- The genetic algorithm supplied the search
- Wisdom of Crowds added a second path to improvement
- What the three project figures show
- What the project delivered
- How the result was checked
- The lesson a student can carry to the next algorithm
- Method and interpretation note
- Frequently asked questions
- What problem did the student choose?
- How does the Wisdom of Crowds step work?
- What did the reported run achieve?
- Does the report prove that GA + WoC is always better than GA alone?
- What did the visualization show?
- Privacy and source note
How Samuel P. turned a student’s CSE-545 assignment brief into a working Python experiment on an NP-complete graph problem.
Project type: Python algorithms, genetic search, and visualization
Student privacy: The student, university, grade, and deadline are not identified.
Relevant topic help: Python Algorithms Homework Help
The assignment started with a choice
The brief did not prescribe one specific NP-complete problem. It asked the student to choose a problem, generate test data, implement a hybrid Genetic Algorithm and Wisdom of Crowds approach, build a visual interface, and run enough experiments to support a project report and later research paper. Samuel P., the Python expert responsible for the implementation, chose a problem that could be explained visually and checked edge by edge.
The implementation chose Minimum Vertex Cover. Given a graph, the goal is to select the smallest possible set of vertices so that every edge touches at least one selected vertex. That makes the problem easy to explain on a screen, but difficult to solve exactly as the graph grows. The project therefore used evolutionary search and collective voting to explore the solution space.
Project snapshot
| Project detail | Result |
|---|---|
| Course project | CSE-545 final project |
| Selected problem | Minimum Vertex Cover on an undirected graph |
| Test graph | 14 nodes, 30% edge probability, no weighted edges |
| Search settings | Population 50, 40 generations, random seed 0 |
| Reported result | Five selected nodes covered every displayed edge |
| Visual output | Graph view, chromosome bars, and fitness history |
The graph became a set of decisions
The test data was generated in Python with NetworkX. The generator created 14 nodes and considered every possible pair. Each pair received a 30 percent chance of becoming an edge. The run used an undirected, unweighted graph, so the algorithm only needed to decide which vertices to select.
The graph also contained an isolated node, 12. Because it had no incident edge, selecting it would not help cover the graph. The visualization made that reasoning visible: orange nodes were selected, blue nodes were left out, and uncovered edges would have been drawn in red.
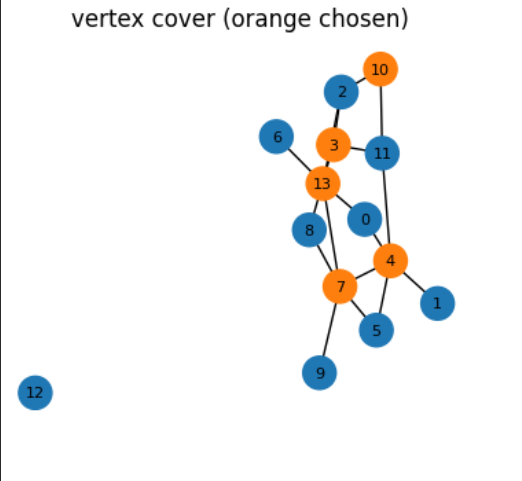
Figure 1. The reported 14-node graph. Orange nodes are selected and blue nodes are not selected. No red edge appears in the supplied result, indicating that every displayed edge is covered.
The fitness function encoded the trade-off
A genetic algorithm needs a score that tells it which candidate solutions are moving in the right direction. Here, the score made feasibility the first priority and compactness the second:
fitness = -(uncovered_edges * 1000) - (0.5 * number_of_selected_vertices)The 1,000-point penalty means that leaving even one edge uncovered is far worse than selecting a few extra vertices. Once a candidate covers every edge, the smaller 0.5 penalty favors a shorter cover. Under this formula, a valid five-node cover scores -2.5, which explains why the best line sits close to zero on the fitness chart.
The genetic algorithm supplied the search
Each candidate was represented as a bitstring. A 1 meant that the corresponding vertex belonged to the cover; a 0 meant that it did not. The run created a population of 50 bitstrings and evolved it for 40 generations with a fixed random seed of 0.
- Tournament selection chose parents from small random groups.
- Single-point crossover combined two parent bitstrings.
- Bit mutation flipped individual decisions with a 10 percent probability.
- Elitism copied the best candidate into the next generation.
This structure gave the search two ways to improve. Crossover could recombine useful patterns from different candidates, while mutation could introduce a vertex decision that the current population had not tried.
Wisdom of Crowds added a second path to improvement
The WoC function first ranked the population by fitness and kept an elite group. It then looked at each bit position separately. If most elite candidates selected a vertex, the consensus child selected it too; if most left it out, the child left it out. That consensus child was inserted into the next population alongside the ordinary genetic offspring.
The report describes a top-five vote, while the submitted function call uses max(3, population size // 5). With a population of 50, the code therefore passes the best 10 candidates to the consensus step. This case study follows the code where it differs from the report wording.
What the three project figures show
The report gives the reader three views of the same run: the selected graph nodes, the chromosome that produced the cover, and the fitness history that shows how the population moved.
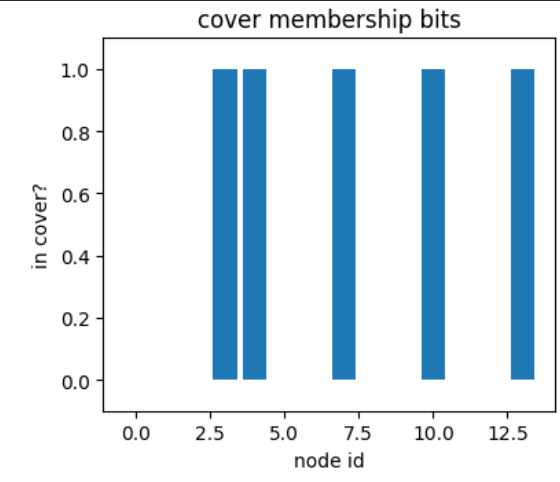
Figure 2. Best chromosome from the reported run. Bars at nodes 3, 4, 7, 10, and 13 indicate a five-node cover.
The bit chart turns the graph result into something a student can inspect line by line. The five bars correspond to the orange nodes in the graph. Together, the two figures show both the abstract representation and the visual solution.
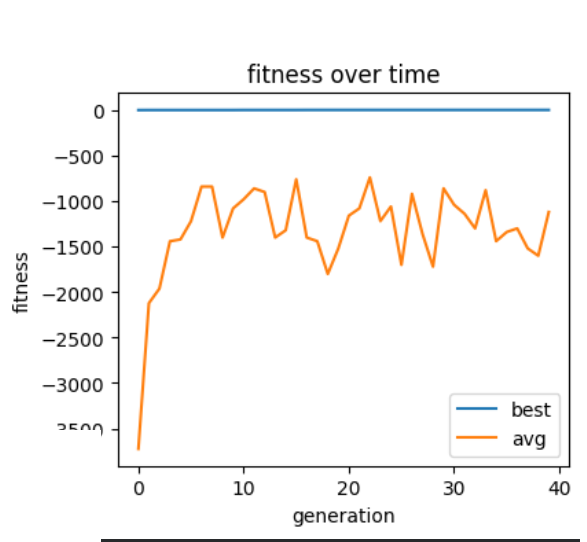
Figure 3. Fitness history for 40 generations. The best curve remains near zero while the population average stays lower because uncovered edges receive a large penalty.
The best curve reaches a feasible solution early and then stays almost flat because the score has little room left to improve. The average curve is much lower because many early candidates still miss edges. As the population learns useful vertex combinations, the average moves upward, although this single run does not establish a general performance guarantee.
What the project delivered
The project produced a commented Python implementation, a random graph generator, a hybrid GA + WoC search loop, and a three-panel Matplotlib visualization. The visualization shows the graph, the winning bitstring, and the best and average fitness histories in one view.
The report also presents a qualitative GA versus GA + WoC comparison. The code exposes a use_woc switch, but the supplied run executes with WoC enabled and does not include a matched table of repeated GA-only and GA + WoC trials. A stronger experimental paper would repeat both settings across the same graph seeds and report feasibility rate, cover size, fitness, and runtime.
How the result was checked
The result was checked at three levels. First, the selected vertices were compared with the graph: every displayed edge had at least one endpoint in the selected set. Second, the chromosome chart was checked against the graph colors. The five active positions, 3, 4, 7, 10, and 13, matched the five orange nodes in the network view. Third, the fitness chart was interpreted using the scoring formula rather than by its shape alone. A feasible five-node cover has no 1,000-point uncovered-edge penalty and therefore receives a score of -2.5.
That last check matters because a curve close to zero is not automatically proof of an optimal solution. It means the candidate is feasible and relatively small under this particular formula. Exact optimality would require either a trusted lower-bound argument, an exact solver on the same graph, or a systematic comparison with known solutions. The project report supports the narrower claim that the implemented run found a valid compact cover.
This is also where the case study keeps the evidence useful for a student. It shows what can be concluded from the supplied run and what would need another experiment. A student reading the report can reproduce the graph, inspect the chromosome, and then extend the code with repeated seeds, a GA-only control, and a table of cover size, feasibility, runtime, and fitness.
The lesson a student can carry to the next algorithm
The useful part of this project is the chain of decisions: choose a representation, make invalid solutions expensive, preserve the best candidate, add a second source of structure, and show the result in a way another person can check.
That chain transfers to Set Cover, scheduling, routing, and other combinatorial assignments. A Python expert can help a student understand each decision, test the code on new graphs, and explain why the final solution is feasible instead of treating the algorithm as a black box.
Students who want broader help with Python coursework can visit the DoMyPythonHomework homepage, while students focused on graph and algorithm assignments can use the related Python Algorithms Homework Help page.
Method and interpretation note
The figures document one seeded 14-node run. They show a valid cover and the behavior of the implemented fitness function. They should not be presented as proof that GA + WoC always outperforms a plain Genetic Algorithm without repeated matched experiments.
Frequently asked questions
What problem did the student choose?
The project chose Minimum Vertex Cover, an NP-complete graph problem in which the objective is to cover every edge with as few selected vertices as possible.
How does the Wisdom of Crowds step work?
It takes the strongest candidates in the current population, votes at each bit position, and inserts the resulting consensus bitstring into the next generation.
What did the reported run achieve?
The report shows five selected nodes covering every displayed edge in a 14-node graph. The graph visualization contains no red uncovered edges.
Does the report prove that GA + WoC is always better than GA alone?
No. It reports a qualitative comparison for the project. Repeated matched runs with and without WoC would be needed to make a general performance claim.
What did the visualization show?
It showed the selected graph nodes, the bitstring representation of the best solution, and best-versus-average fitness over 40 generations.
Privacy and source note
The case study does not publish the student’s name, university, grade, or private submission. It was written and technically reviewed by Samuel P., Python Expert, based on the CSE-545 project requirement, the Python implementation, and the project report. Students who need additional study material can review the site’s Python Learning Resources.
Have a Python project like this one? We ship working code with a walkthrough.