Data Envelopment Analysis in Excel: A Worked Nursing Home Study
Contents · 36 sections
- Quick facts from the supplied DEA model
- What the assignment asks you to do
- DEA in plain language
- Filtering the historical nursing-home data
- Choosing the six inputs
- Defining the eight outputs
- Setting up the multiplier model in Excel
- What the supplied workbook reports
- Why every DMU receives a score of 1.000
- The model has many variables relative to the sample
- Several weights are zero or close to zero
- The sample may be similar across the selected facilities
- The result is relative to the selected sample
- Adding the quality-weight restriction
- The validation issue students should catch
- A student-friendly Excel workflow
- 1. Preserve the raw sheet
- 2. Apply the assignment filter
- 3. Copy only the modeling variables
- 4. Create one weight block per selected DMU
- 5. Set Solver for the baseline model
- 6. Record the baseline result
- 7. Add the quality restriction
- 8. Recalculate the first 10 DMUs
- 9. Perform a final audit
- How to discuss the results in a report
- Common questions about this DEA spreadsheet
- What is Data Envelopment Analysis?
- What is the DMU in this nursing-home example?
- Why are NOCATH, NOREST, and NOSORE outputs?
- Does an efficiency score of 1.000 mean the nursing home provides the best care?
- Why did all 33 DMUs receive 1.000?
- How do I verify the theta = 1 restriction?
- Can I use this historical dataset to judge current nursing-home performance?
- Final takeaway
- Sources used for this walkthrough
A worked Data Envelopment Analysis model built in Excel with Solver, from filtered nursing home data.
Project type: Excel Data Envelopment Analysis (DEA) and Solver assignment
Related help: Data Science Homework Help
Student privacy: The student’s name, course, and submission deadline are not published. The nursing home dataset was already anonymized to DMU labels in the supplied workbook.
This walkthrough explains a Data Envelopment Analysis (DEA) model built in Excel from historical nursing home data. The supplied workbook filters 33 Worcester County decision-making units with at least 90 residents, combines 6 staffing inputs with 8 resident and quality outputs, and reports an efficiency score of 1.000 for every selected unit.
That flat result is the most useful part of the exercise. A score of 1.000 means each unit sits on the model’s calculated frontier under its chosen weights. It does not mean every facility delivers identical care, and it does not create a league table of nursing homes. The calculation is a relative comparison inside one dataset.
Students working through a similar programming or data-analysis brief can use this example to see how a spreadsheet model moves from raw records to a filtered sample, a Solver structure, an efficiency score, and a validation check.
Quick facts from the supplied DEA model
| Project element | Supplied workbook detail |
|---|---|
| Method | Data Envelopment Analysis |
| Source context | Historical OSCAR nursing-home data collected around 2003 |
| Geographic filter | Worcester County, Massachusetts |
| Size filter | At least 90 residents |
| Decision-making units | 33 anonymized DMUs |
| Inputs | 6 staffing FTE measures |
| Outputs | 5 quantity measures and 3 quality measures |
| Solver result | 1.000 efficiency for all 33 DMUs |
| Quality-constraint parameter | Theta = 1 |
| Key validation lesson | Check the weight columns, not only the displayed score |
What the assignment asks you to do
The supplied exercise frames DEA as a way to compare nursing homes while considering both resource use and service outcomes. A cost-only comparison would be incomplete because lower staffing can reduce cost while also reducing the level of care. The exercise therefore treats staffing as inputs and resident volume, resident dependency, and selected quality indicators as outputs.
The work has two main stages:
- Build a DEA model for nursing homes in Worcester County with at least 90 residents.
- Add a quality-weight restriction with theta = 1, calculate new scores for the first 10 DMUs, and compare the new values with the original scores.
The spreadsheet contains the full source table as well as a filtered modeling table. The filtered table is the important starting point for the Solver model.
DEA in plain language
Data Envelopment Analysis measures relative efficiency for several comparable decision-making units, or DMUs. A DMU can be a nursing home, hospital, bank branch, school, or production site.
The method works with several inputs and outputs at the same time:
- Inputs are resources used by the DMU.
- Outputs are services, volume, or quality measures produced by the DMU.
- Weights convert each input and output into a comparable contribution.
- The efficiency score compares weighted outputs with weighted inputs.
For a selected DMU 0, the multiplier form can be written as:
Efficiency of DMU 0 = weighted outputs of DMU 0 / weighted inputs of DMU 0The model chooses the weights that give the selected DMU its best possible score, while requiring the same weights to keep every other DMU at or below the frontier. The usual interpretation is:
- A score of 1.000 means the DMU is efficient relative to the sample and model.
- A score below 1.000 means the DMU is inside the frontier.
- A score of 1.000 is not a clinical quality grade.
- The result depends on the selected DMUs, variables, orientation, and constraints.
This flexibility is useful, but it also creates a risk. If the model has many variables and weak restrictions, many DMUs can receive a score of 1.000.
Filtering the historical nursing-home data
The raw workbook contains 398 records plus a header row. The exercise restricts the analysis to Worcester County facilities with at least 90 residents. The filtered sheet contains 33 records.
The resident count in the filtered sample ranges from 90 to 165, with a mean of 126.58 residents. The sample therefore has a clear lower bound but still includes facilities of different sizes.
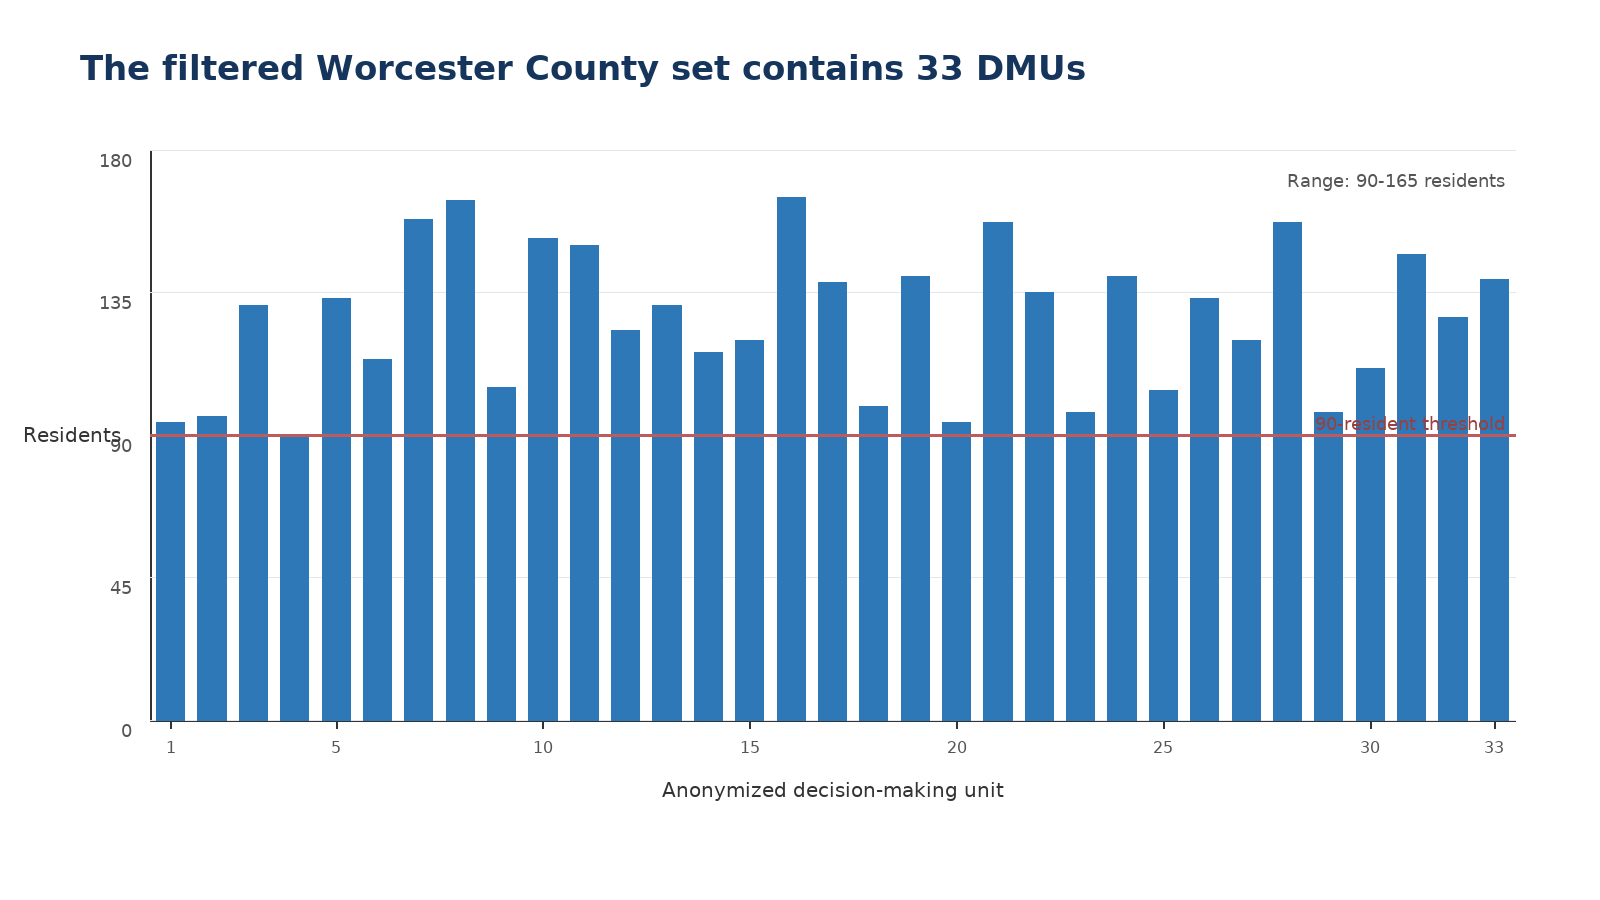
Figure 1. The supplied filter leaves 33 anonymized DMUs. The chart uses DMU labels rather than publishing facility names or provider identifiers.
In Excel, the filter logic can be expressed as:
COUNTY = "WORCESTER"
TOTRES >= 90
A clean workflow keeps the raw table unchanged and copies only the qualifying rows into a modeling sheet. That makes the analysis easier to audit and prevents a temporary filter from being mistaken for the final dataset.
Before opening Solver, check three things:
- Every selected row has ‘COUNTY’ = ‘WORCESTER’.
- Every selected row has ‘TOTRES’ >= 90.
- The count of selected DMUs is 33.
A simple count check is valuable:
=COUNTIFS(H:H,"WORCESTER",AN:AN,">=90")The exact column letter depends on the worksheet layout. Use the header name in the actual workbook rather than assuming a fixed column position.
Choosing the six inputs
The exercise treats labor as the main input under management control. The model uses these six full-time-equivalent staffing variables:
| Input field | Meaning |
|---|---|
| RN_FTE | Registered nurse full-time equivalents |
| LPN_FTE | Licensed practical nurse full-time equivalents |
| AIDE_FTE | Nursing aide full-time equivalents |
| ADMIN_FTE | Administrative staff full-time equivalents |
| ANCNON_FTE | Ancillary non-nursing non-professional staff FTEs |
| ANCPRO_FTE | Ancillary non-nursing professional staff FTEs |
The six input columns describe resources. A larger input value means the DMU uses more of that staffing category, so the model treats these variables as quantities to control.
The input choice also shows why DEA is useful here. A single staffing ratio would hide the difference between registered nurses, aides, and non-nursing staff. DEA keeps those categories visible and lets the model assign weights.
Defining the eight outputs
The workbook uses five quantity outputs and three quality outputs.
The quantity outputs measure residents who require help with common Activities of Daily Living:
- BATH_DEP: residents dependent on assistance with bathing
- DRES_DEP: residents dependent on assistance with dressing
- TRANS_DEP: residents dependent on assistance with transferring
- TOIL_DEP: residents dependent on assistance with toileting
- EAT_DEP: residents dependent on assistance with eating
The three quality outputs are:
- NOCATH: residents without a catheter
- NOREST: residents without physical restraints
- NOSORE: residents without pressure sores
The quality variables are written as “residents without” measures so that a larger value represents a better direction for an output. For example:
NOCATH = TOTRES - residents with catheter
NOREST = TOTRES - residents with restraints
NOSORE = TOTRES - residents with pressure sores
The model therefore combines 6 staffing inputs with 5 quantity outputs and 3 quality outputs.
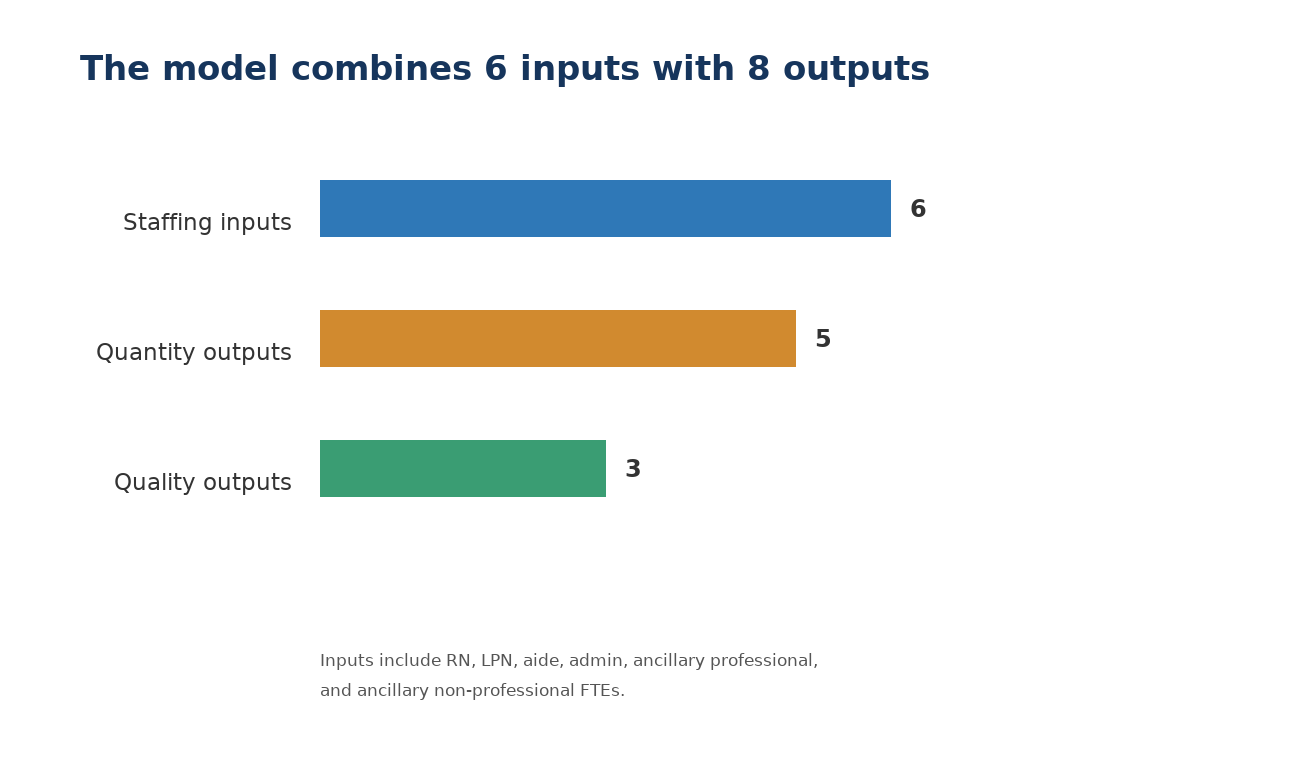
Figure 2. The model structure from the supplied workbook.
Setting up the multiplier model in Excel
A practical spreadsheet separates the model into four blocks:
- The selected DMU’s input and output data.
- Input and output weight cells.
- Weighted input and weighted output calculations.
- Solver objective and constraint cells.
For one DMU, the weighted input total is:
Weighted input =
RN_FTE * weight_RN
+ LPN_FTE * weight_LPN
+ AIDE_FTE * weight_AIDE
+ ADMIN_FTE * weight_ADMIN
+ ANCNON_FTE * weight_ANCNON
+ ANCPRO_FTE * weight_ANCPRO
The weighted output total follows the same pattern:
Weighted output =
BATH_DEP * weight_BATH_DEP
+ DRES_DEP * weight_DRES_DEP
+ TRANS_DEP * weight_TRANS_DEP
+ TOIL_DEP * weight_TOIL_DEP
+ EAT_DEP * weight_EAT_DEP
+ NOCATH * weight_NOCATH
+ NOREST * weight_NOREST
+ NOSORE * weight_NOSORE
The baseline DEA setup normally includes these constraints:
- Set the selected DMU’s weighted input total equal to 1.
- Keep the weighted output total for every DMU no greater than its weighted input total.
- Keep every input and output weight non-negative.
- Maximize the selected DMU’s weighted output total.
The workbook uses SUMPRODUCT formulas for weighted blocks. A typical Excel formula looks like:
=SUMPRODUCT(InputValues,InputWeights)and the difference cell is:
=TotalWeightedOutputs-TotalWeightedInputsIf the model is set correctly, the selected DMU’s weighted input total equals 1, the weighted output total is at most 1 for every comparison unit, and the target DMU’s efficiency is the maximum value allowed by the constraints.
What the supplied workbook reports
The supplied workbook reports:
- Total weighted inputs of approximately 1.000 for each DMU.
- Total weighted outputs of approximately 1.000 for each DMU.
- A difference of approximately 0.000.
- An efficiency score of 1.000 for all 33 DMUs.
The first 10 reported scores are:
| DMU | Original score | New score | Reported difference |
|---|---|---|---|
| NH1 | 1.000 | 1.000 | 0.000 |
| NH2 | 1.000 | 1.000 | 0.000 |
| NH3 | 1.000 | 1.000 | 0.000 |
| NH4 | 1.000 | 1.000 | 0.000 |
| NH5 | 1.000 | 1.000 | 0.000 |
| NH6 | 1.000 | 1.000 | 0.000 |
| NH7 | 1.000 | 1.000 | 0.000 |
| NH8 | 1.000 | 1.000 | 0.000 |
| NH9 | 1.000 | 1.000 | 0.000 |
| NH10 | 1.000 | 1.000 | 0.000 |
The full efficiency column has the same pattern.
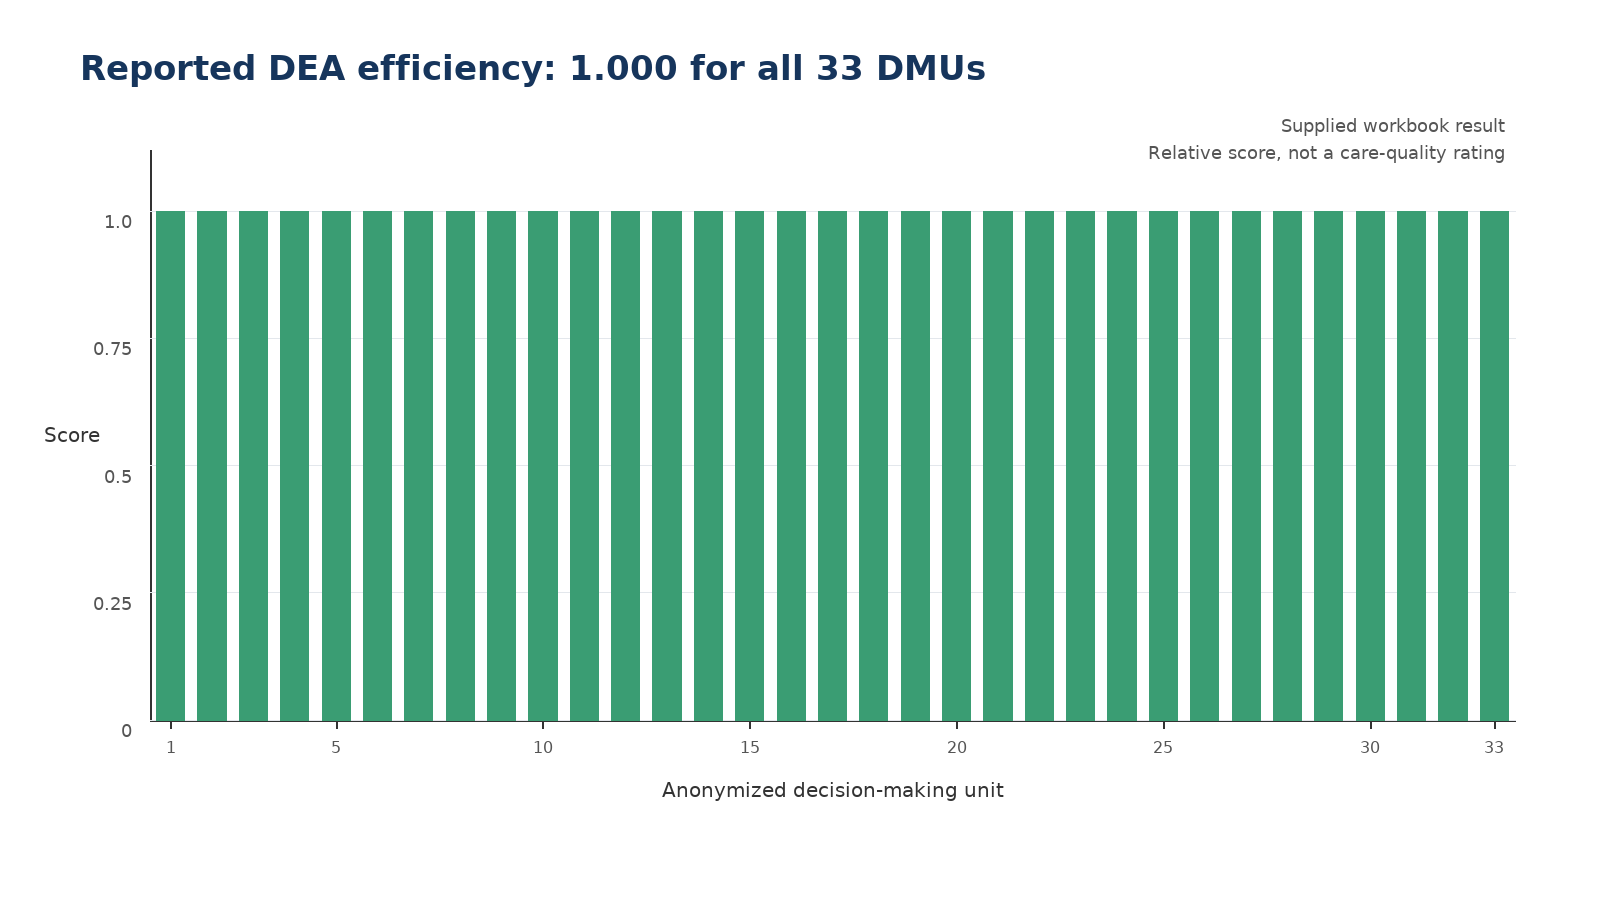
Figure 3. The workbook reports a flat 1.000 efficiency result for all 33 DMUs.
A flat frontier is a finding, not a mistake by itself. It means the selected model does not distinguish the units under its current weight structure. The next question is why.
Why every DMU receives a score of 1.000
Four explanations deserve attention.
The model has many variables relative to the sample
The model contains 6 inputs and 8 outputs for 33 DMUs. Each DMU can choose its own weight combination. A flexible multiplier model can make many units look efficient when the sample is not large relative to the number of variables.
Several weights are zero or close to zero
A DMU can receive a high score by emphasizing the variables where it looks strongest and assigning little or no weight to other variables. That is one reason the assignment adds a quality-weight restriction.
The supplied workbook shows different weight patterns across DMUs. For example, some units receive their main input weight on administrative staff, while others receive the largest weight on licensed practical nurses or aides. The model is selecting a favorable combination for each DMU.
The sample may be similar across the selected facilities
The 33 facilities are all from the same county and meet the same resident threshold. Similarity can reduce discrimination because many records sit close to the same frontier.
The result is relative to the selected sample
A unit can be efficient inside this 33-DMU sample and receive a lower score after adding facilities from another county or changing the output definition. DEA does not produce a universal efficiency label.
A good discussion sentence is:
The model identifies every selected DMU as efficient under the supplied variables and weight structure, so the result demonstrates frontier membership rather than a meaningful ranking among the facilities.
Adding the quality-weight restriction
The exercise proposes this restriction:
min(quality weights) >= theta * max(quantity weights)With theta = 1, the smallest quality-output weight must be at least as large as the largest quantity-output weight for the same DMU.
The purpose is clear. Without a restriction, Solver can assign little or no value to quality outputs while still maximizing the efficiency score. The restriction forces the quality measures to influence the result.
For the workbook’s weight layout, the correct validation logic is conceptually:
Minimum quality weight = MIN(weight_NOCATH, weight_NOREST, weight_NOSORE)
Maximum quantity weight = MAX(weight_BATH_DEP, weight_DRES_DEP,
                              weight_TRANS_DEP, weight_TOIL_DEP,
                              weight_EAT_DEP)
Constraint check = Minimum quality weight - Maximum quantity weight >= 0
If the weights are in the stored DEA_Model columns, the corresponding range formulas are:
=MIN(AA5:AC5)
=MAX(V5:Z5)
=MIN(AA5:AC5)-MAX(V5:Z5)
The row numbers change for other DMUs. The important distinction is the range: V:Z contains quantity-output weights, while AA:AC contains quality-output weights.
The validation issue students should catch
The workbook displays cells named MIN_Quality_Weight and MAX_Quantity_Weight, but the formulas in the final comparison section use the raw output columns:
=MIN(NOCATH:NOSORE)
=MAX(BATH_DEP:EAT_DEP)
Those formulas compare resident counts, not weights. They do not test the DEA restriction.
We audited the stored weight columns separately. Under the stated condition min quality weight >= max quantity weight, 12 of the 33 DMUs pass and 21 do not. That means the workbook’s displayed validation section does not prove that theta = 1 was enforced across the model.
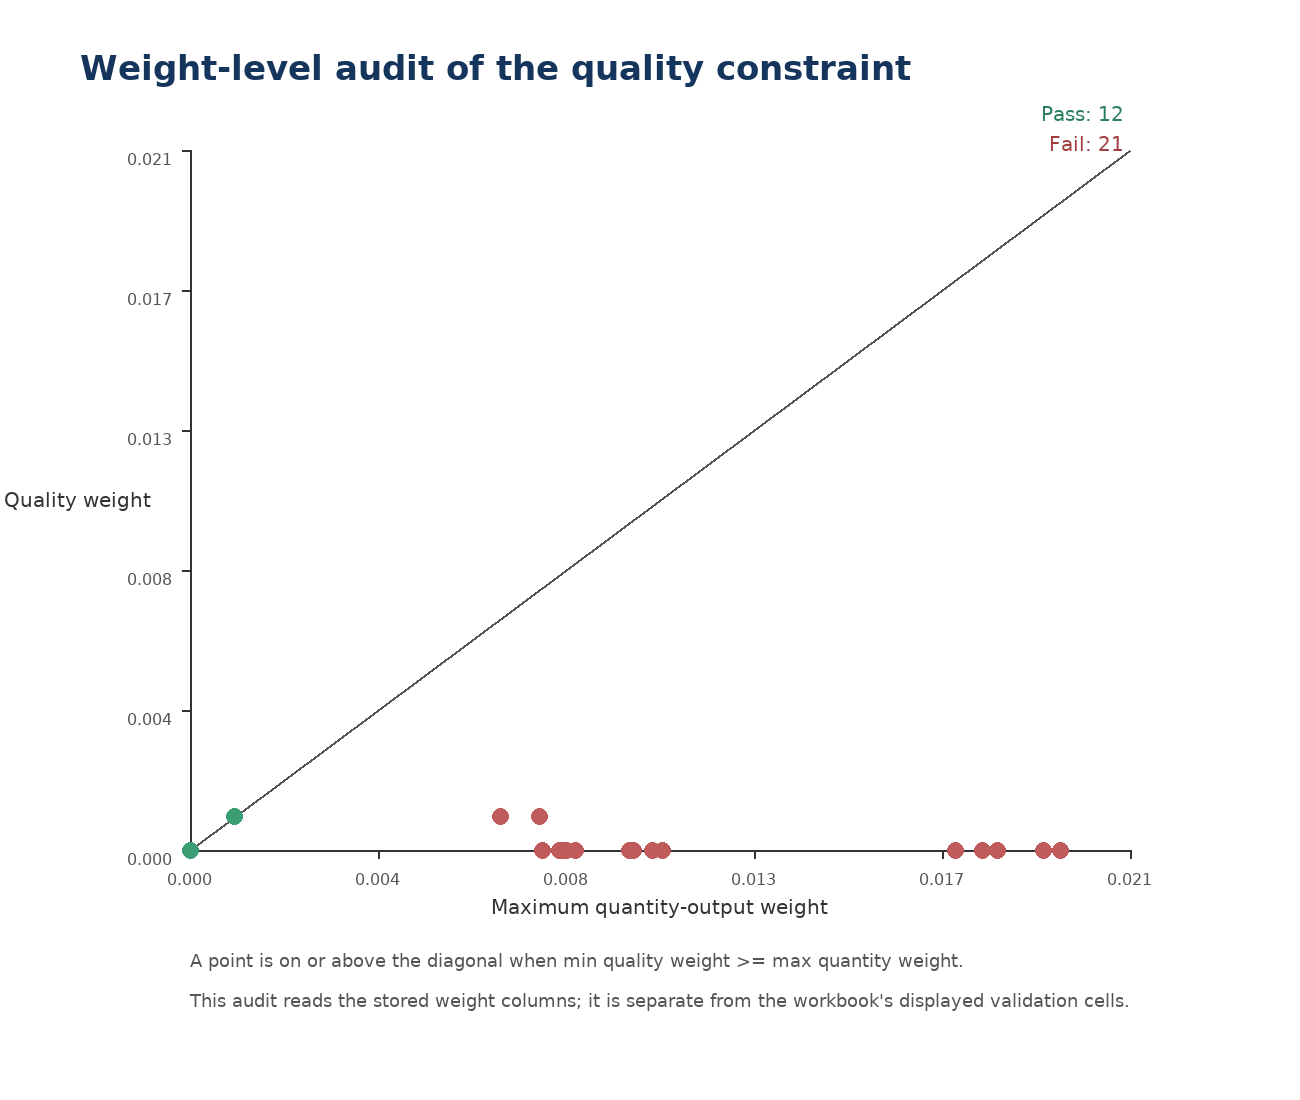
Figure 4. This audit uses the workbook’s stored weight columns. Green points satisfy the stated inequality; red points do not.
This distinction changes how the result should be written. The workbook reports unchanged efficiency scores, but the quality constraint requires a formula and Solver audit before the result can be presented as a fully validated constrained DEA model.
A student-friendly Excel workflow
Use this sequence when building a similar DEA assignment.
1. Preserve the raw sheet
Keep the original OSCAR table unchanged. Add a separate sheet for the filtered sample and another for the DEA calculations.
2. Apply the assignment filter
Select COUNTY = WORCESTER and TOTRES >= 90. Count the resulting rows. The supplied filtered sample contains 33 DMUs.
3. Copy only the modeling variables
Create a compact table containing the DMU identifier, 6 inputs, 5 quantity outputs, and 3 quality outputs. Remove unrelated columns from the Solver area, but keep the full raw sheet for traceability.
4. Create one weight block per selected DMU
Place the 6 input weights and 8 output weights beside the selected row. Use SUMPRODUCT for weighted totals rather than typing repeated multiplication terms throughout the sheet.
5. Set Solver for the baseline model
Maximize the selected DMU’s weighted output total. Set its weighted input total to 1. Add the comparison constraints for every DMU. Set all weights to non-negative values.
6. Record the baseline result
Save the efficiency score, weighted input total, weighted output total, difference, and calculated weights before changing the model.
7. Add the quality restriction
Add the pairwise restrictions that enforce:
Every quality weight >= theta * every quantity weightWith theta = 1, each quality-output weight must be at least as large as each quantity-output weight. A single minimum-versus-maximum check is an efficient way to validate the result after Solver runs.
8. Recalculate the first 10 DMUs
Copy the new scores into a comparison table. Report the score change as:
New score - Original scoreThen explain whether the constraint changed the frontier, changed selected weights, or left the reported scores unchanged.
9. Perform a final audit
Check the raw-data count, weight signs, weighted input normalization, comparison-unit constraints, quality-weight inequality, and score range. A model that displays 1.000 in every row still needs these checks.
How to discuss the results in a report
A strong discussion separates what the spreadsheet shows from what the analyst can conclude.
The spreadsheet shows that all 33 selected DMUs receive a reported efficiency score of 1.000. It also shows that the first 10 displayed scores do not change after the workbook’s constrained section is applied.
The result does not show that every facility is equally good. It shows that the model, data sample, and selected weights do not create an interior unit below the frontier. The flat result may reflect a flexible model, a small comparison set relative to the number of variables, similar facilities, or weakly enforced weight restrictions.
The validation issue matters because the displayed minimum and maximum cells use resident output counts instead of the corresponding weight cells. A corrected report should either:
- Re-run Solver with the quality constraints linked to the weight cells.
- Correct the validation formulas and label the current score comparison as workbook-reported.
- Explain that the existing workbook does not independently prove theta = 1 was enforced.
That language is more accurate than calling the result a definitive ranking.
Common questions about this DEA spreadsheet
What is Data Envelopment Analysis?
Data Envelopment Analysis is a linear-programming method that compares several decision-making units using multiple inputs and outputs. It builds a relative efficiency frontier from the observed sample.
What is the DMU in this nursing-home example?
Each selected nursing home is treated as a decision-making unit. The published walkthrough uses labels such as NH1 and NH10 so that the article focuses on the model rather than facility names.
Why are NOCATH, NOREST, and NOSORE outputs?
They are defined as the number of residents without the corresponding adverse condition. A larger value therefore points in the desired output direction for this model.
Does an efficiency score of 1.000 mean the nursing home provides the best care?
No. It means the unit is efficient relative to the selected sample, variables, and constraints. It is not a clinical rating or a universal quality judgment.
Why did all 33 DMUs receive 1.000?
The supplied workbook reports a complete frontier. The likely contributors are flexible DMU-specific weights, 14 variables across 33 units, similarities in the filtered sample, and the need to verify the quality-weight restriction.
How do I verify the theta = 1 restriction?
Calculate MIN(quality-output weights) - MAX(quantity-output weights) for each DMU. The value should be zero or positive. Use the weight columns, not the raw resident-count columns.
Can I use this historical dataset to judge current nursing-home performance?
No. The exercise uses historical data for a classroom DEA model. It does not measure current performance, current staffing, or current resident outcomes.
Final takeaway
This DEA exercise teaches two skills at once. The first is model construction: filter the data, define inputs and outputs, create Solver weights, normalize the selected DMU, and compare weighted totals. The second is analytical judgment: read a flat score distribution carefully, test whether the constraint points to the correct cells, and separate a workbook’s displayed result from a validated conclusion.
The supplied model reports 1.000 for all 33 DMUs. The most useful student response does not stop there. It explains what the result means, identifies the weight-level validation issue, and states the additional check required before treating the constrained model as final.
For help understanding a related programming or data-analysis brief, visit our Python programming assignment help page and include the exact spreadsheet section, formula, or Solver setting that is causing difficulty.
Sources used for this walkthrough
- Supplied Data Envelopment Analysis exercise PDF.
- Supplied DEA assignment spreadsheet and filtered model sheet.
- Supplied DEA solving shell and module instruction PDF.
- Chambers, C. classroom exercise materials cited in the supplied brief.
- Shimshak, Lenard, and Klimberg, “Incorporating Quality into Data Envelopment Analysis of Nursing Home Performance: A Case Study,” cited in the supplied exercise.
Stuck on a Python assignment? We ship working code with a walkthrough.