Data Cleaning in Python with pandas: A 1 Million Row Project
Contents · 23 sections
- What the data-cleaning assignment asked for
- The three CSV files in numbers
- Load the files and read the warning instead of hiding it
- Inspect types, missing values, and duplicates before changing data
- Convert dates before calculating time differences
- Missing-value handling is a policy decision
- Decide whether sparse transaction columns should be filled or removed
- Outlier checks should find candidates, not automatic errors
- Left joins preserve transactions, but they can still create missing attributes
- Validate the merge with counts and totals
- Create account-year and account-age features
- qcut and cut answer different questions
- What the notebook does well
- What should be revised before submission
- What students can learn from this project
- Common questions about this pandas cleaning workflow
- Why use a left join for the transaction merge?
- Does an unchanged row count prove that a merge is correct?
- Should missing numeric values always be filled with the mean?
- What is the difference between pd.qcut and pd.cut?
- Why is -999 risky as a missing-value marker?
- Is this exact notebook ready to submit?
- Expert and source note
A practical walkthrough of a Jupyter Notebook that cleans account, district, and transaction data, then checks whether a million-row merge can be trusted.
Project type: Python data-cleaning assignment with pandas
Related help: Pandas Homework Help
Student privacy: The student’s name, university, grade, and deadline are not published.
The code in a data-cleaning assignment is often short. The difficult work happens between the lines: deciding whether a missing value should be averaged, replaced with a sentinel, or removed; checking whether a join silently loses records; and making sure a category means what its label says.
This project makes those decisions visible. The supplied files contain 4,500 accounts, 76 district records, and 1,056,320 bank transactions. The notebook converts dates, handles missing values, joins the three tables, creates account-age and transaction-amount categories, and checks that the merge preserves important totals.
It also contains several places where the executed solution and the written brief do not agree. Those differences are useful. A strong assignment walkthrough should show what the code actually did, what the output proves, and what still needs correction before submission.
If you are working through a similar brief, python programming assignment help can help you isolate the stage that needs attention instead of treating the whole notebook as one problem.
What the data-cleaning assignment asked for
The brief supplied with the project lists a sequence of pandas tasks:
- import three CSV files as
account,district, andtransDataFrames; - inspect each table with previews, summaries, unique-value counts, and duplicate checks;
- convert the account and transaction date columns to datetime;
- standardize district and region names in uppercase;
- find and fill missing data;
- inspect suspicious district values with descriptive statistics and histograms;
- left-join account data to districts, then join transactions to the result;
- locate and remove rows left incomplete by the merge;
- create account-open year and account-age features;
- divide transaction amounts into three equal-frequency categories;
- divide account ages into five equal-width categories;
- explain every coding step.
The notebook follows the overall load-clean-merge-engineer-validate sequence. It does not implement every instruction exactly as written, so this article treats the requirement and the executed notebook as two separate pieces of evidence.
That separation is a good habit for any large project. Our Python homework workflow explains how to keep the brief, working code, outputs, and final explanation aligned.
The three CSV files in numbers
The first checkpoint is the shape of each raw table.
| DataFrame | Rows | Columns | Role |
|---|---|---|---|
account | 4,500 | 5 | Account, client, district, frequency, and opening date |
district | 76 | 7 | District name, region, population, salary, unemployment, and crime fields |
trans | 1,056,320 | 10 | Transaction dates, types, amounts, balances, and partner details |
The account-opening dates run from January 1, 1993, to December 29, 1997. The transaction dates run from January 1, 1993, to December 31, 1998. A separate audit of the supplied CSV files found no invalid dates after parsing and no fully duplicated rows in any of the three tables.
Those numbers matter because they establish a baseline. If a later merge changes 1,056,320 transaction rows into a larger or smaller total without an explained reason, the cleaning process has changed the unit of analysis.
Load the files and read the warning instead of hiding it
The notebook imports pandas, NumPy, Matplotlib, and Seaborn, then reads the three CSV files:
import pandas as pd
import numpy as np
import matplotlib.pyplot as plt
import seaborn as sns

account = pd.read_csv(
    "account-0e78b84b6de22fda7eb0b28d043630c4.csv"
)
district = pd.read_csv(
    "district-768ec01b5d9025a9762636e16d3a803b.csv"
)
trans = pd.read_csv("trans.csv")
The saved run raises a DtypeWarning for one transaction column because pandas sees mixed value types. That warning is not automatically a failure. It is a prompt to inspect the column before choosing a type.
In this notebook, the affected partner fields are removed later because they are mostly missing and are not required for the final features. If those fields were needed, a better import would assign an explicit dtype or use low_memory=False and inspect the resulting values before conversion.
The important human step is not suppressing the warning. It is deciding whether the column belongs in the analysis and recording why.
Inspect types, missing values, and duplicates before changing data
The notebook prints the column types and missing-value counts. The raw files show a very different missing-data pattern in each table:
| DataFrame and column | Missing rows |
|---|---|
account, all columns | 0 |
district.average_salary | 10 |
district.unemployment_rate | 10 |
district.num_committed_crimes | 9 |
trans.operation_type | 183,114 |
trans.description | 481,881 |
trans.partner_bank | 782,812 |
trans.partner_account | 760,931 |
This is why one blanket cleaning rule would be weak. A district salary field and a transaction partner-account field have different meanings, different missingness rates, and different consequences for later work.
The brief also asks for unique-value counts and duplicate checks. The executed notebook calls drop_duplicates() on the transaction data but does not show the duplicate count first. The raw-file audit found zero complete duplicate rows, so no transaction rows needed removal in this copy.
A more auditable pattern is:
for name, frame in {
    "account": account,
    "district": district,
    "trans": trans,
}.items():
    print(name, "shape:", frame.shape)
    print(name, "duplicate rows:", frame.duplicated().sum())
    print(frame.isna().sum())
Printing the count before changing the table tells the reader whether cleaning had an effect.
Convert dates before calculating time differences
The notebook converts both date fields with errors="coerce":
account["account_open_date"] = pd.to_datetime(
    account["account_open_date"], errors="coerce"
)

trans["date"] = pd.to_datetime(
    trans["date"], errors="coerce"
)
errors="coerce" changes an invalid date into NaT. That keeps the notebook running, but it also creates a new validation duty: count the NaT values after conversion. In the supplied files, both conversions produced zero invalid dates.
The brief also asks for district_name and region to be uppercase. The executed notebook does not apply that transformation. An assignment-aligned revision would add:
district[["district_name", "region"]] = district[
    ["district_name", "region"]
].apply(lambda column: column.str.upper())
This is a presentation standardization, not a change to the underlying district IDs used in the merge.
Missing-value handling is a policy decision
The written brief asks for missing numeric district values to be filled with their column averages. From the raw district file, those means are approximately:
| Column | Mean in the supplied file |
|---|---|
average_salary | 8,984.38 |
unemployment_rate | 3.84 |
num_committed_crimes | 5,164.57 |
The notebook instead fills every missing numeric district value with -999:
for col in district.columns:
    if district[col].dtype == "object":
        district[col] = district[col].fillna("UNKNOWN")
    else:
        district[col] = district[col].fillna(-999)
A sentinel such as -999 makes missingness easy to spot, but it can distort averages, histograms, correlations, and models if it is treated as a real number. Mean imputation has its own limitation: it reduces variation and can make a column look more certain than it is.
For this assignment, the simplest defensible choice is to follow the brief and add a missingness flag if the later analysis needs to remember which values were imputed:
numeric_district_cols = [
    "average_salary",
    "unemployment_rate",
    "num_committed_crimes",
]

for col in numeric_district_cols:
    district[f"{col}_was_missing"] = district[col].isna()
    district[col] = district[col].fillna(district[col].mean())
That small flag preserves part of the information that mean imputation would otherwise hide.
Decide whether sparse transaction columns should be filled or removed
The brief asks for missing numeric transaction values to become -999 and missing categorical values to become UNKNOWN. The notebook makes a more selective choice:
trans = trans.drop(
    ["description", "partner_bank", "partner_account"],
    axis=1,
)
trans["operation_type"] = trans["operation_type"].fillna("UNKNOWN")
Dropping the three sparse fields reduces the transaction table from 10 columns to 7. That is reasonable when the analysis only needs amounts, balances, dates, transaction type, and account IDs. It is not the same as the requested imputation rule, and it removes information that might matter in a different analysis.
The written explanation should therefore say, plainly, that these columns were excluded because they were highly incomplete and were not used by the required features. It should not claim that every missing transaction value was filled.
Outlier checks should find candidates, not automatic errors
The assignment asks for describe() and histograms on suspicious district columns. The submitted notebook produces transaction-amount and account-age histograms later, but it does not show the requested district outlier analysis.
Using the common 1.5 × IQR screening rule on the raw district file produces these candidate counts:
| District column | Values outside the 1.5 × IQR bounds |
|---|---|
population | 6 |
average_salary | 3 |
unemployment_rate | 1 |
num_committed_crimes | 5 |
These are review candidates, not proof of bad data. A capital district can genuinely have a much larger population or crime count than a rural district. The human work is checking the context before replacing or deleting anything.
numeric_cols = district.select_dtypes(include="number").columns

for col in numeric_cols:
    q1 = district[col].quantile(0.25)
    q3 = district[col].quantile(0.75)
    iqr = q3 - q1
    lower = q1 - 1.5 * iqr
    upper = q3 + 1.5 * iqr

    candidates = district[
        (district[col] < lower) | (district[col] > upper)
    ]
    print(col, len(candidates))
This code identifies records to inspect. It does not silently edit them.
Left joins preserve transactions, but they can still create missing attributes
The notebook first joins accounts to districts, then joins transactions to the combined table:
account_district = pd.merge(
    account, district, how="left", on="district_id"
)

merged = pd.merge(
    trans, account_district, how="left", on="account_id"
)
The saved output reports a final merge shape of (1056320, 17). The transaction row count is unchanged, which is a good first sign.
A separate key audit reveals a more specific issue:
- all 1,056,320 transactions match an account;
- 40 account rows use
district_id77; - the district table contains only 76 rows and has no matching district 77;
- those 40 accounts are associated with 10,056 transaction rows;
- those 10,056 rows retain their transaction and account fields but have missing district attributes.
This is the kind of problem a left join is supposed to expose. The rows are not lost, but the enrichment is incomplete.
A safer merge adds relationship validation and an indicator:
account_district = account.merge(
    district,
    how="left",
    on="district_id",
    validate="many_to_one",
    indicator=True,
)

print(account_district["_merge"].value_counts())
print(
    account_district.loc[
        account_district["_merge"] == "left_only",
        ["account_id", "district_id"],
    ]
)
The brief says to find and drop the incomplete rows after the first merge. The notebook does not perform that step. Whether those 40 accounts should be removed, corrected, or retained with an UNKNOWN district requires a stated rule. Deleting them without recording the effect would also remove 10,056 otherwise valid transactions from the later analysis.
Validate the merge with counts and totals
The strongest part of the submitted notebook is its post-merge validation:
print("Original rows in trans:", len(trans))
print("Rows after merge:", len(merged))
print("Sum of amount (before):", trans["amount"].sum())
print("Sum of amount (after):", merged["amount"].sum())
print("Mean balance (before):", trans["balance"].mean())
print("Mean balance (after):", merged["balance"].mean())
The saved run reports:
| Check | Before merge | After merge |
|---|---|---|
| Rows | 1,056,320 | 1,056,320 |
Sum of amount | 6,257,793,560.30 | 6,257,793,560.30 |
Mean balance | 38,518.3308 | 38,518.3308 |
Matching totals show that the join did not multiply or remove transaction rows. They do not prove that every district attribute matched, which is why row preservation and key completeness need separate checks.
This distinction is easy to miss: a merge can preserve the total transaction amount and still leave thousands of rows without district data.
Create account-year and account-age features
The notebook derives the opening year and the number of days between the opening date and each transaction:
merged["account_open_year"] = (
    merged["account_open_date"].dt.year
)

merged["account_age_days"] = (
    merged["date"] - merged["account_open_date"]
).dt.days
The supplied data produces account ages from 0 to 2,190 days. No transaction occurs before its account-opening date, so there are no negative account ages.
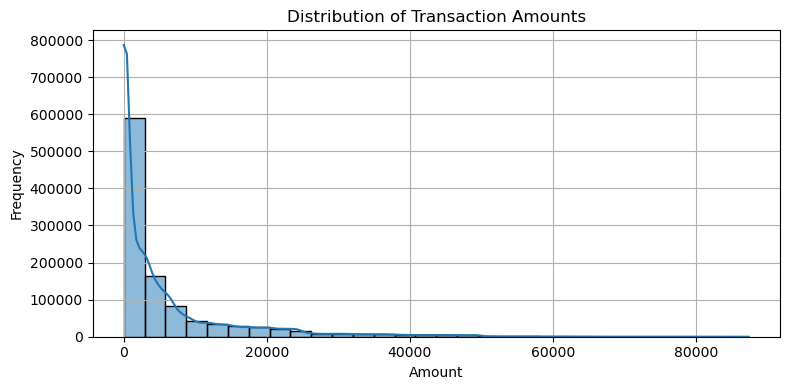
Figure 1. Transaction amounts are strongly right-skewed, with many smaller transactions and a long upper tail.
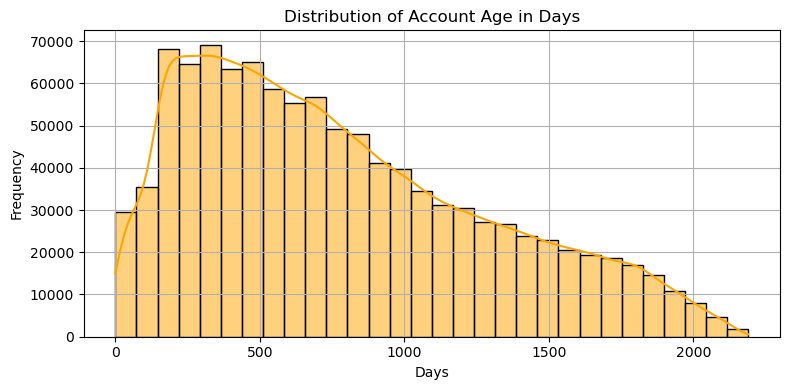
Figure 2. Transaction frequency is highest during the earlier part of the account lifecycle and declines across older account ages.
The transaction histogram explains why an equal-width amount scale would create unbalanced groups. It also explains why qcut, which targets similar record counts, can be useful for this feature.
qcut and cut answer different questions
The brief asks for three equal-frequency amount bins labeled low_amount, medium_amount, and high_amount:
merged["amount_category"] = pd.qcut(
    merged["amount"],
    q=3,
    labels=["low_amount", "medium_amount", "high_amount"],
)
On the supplied data, those three groups contain approximately 352,118, 352,394, and 351,808 rows. Ties at the boundaries explain the small differences.
The notebook instead creates five quantile groups numbered 0 through 4:
merged["amount_category"] = pd.qcut(
    merged["amount"],
    q=5,
    labels=False,
    duplicates="drop",
)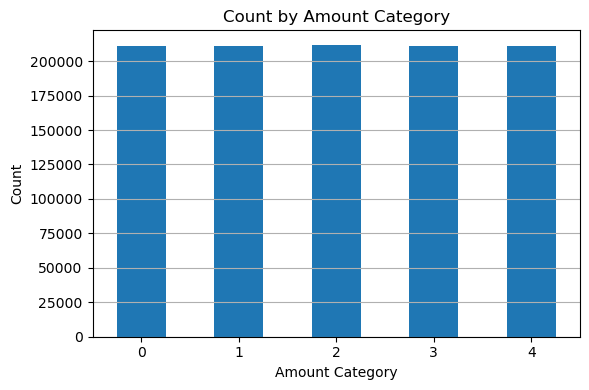
Figure 3. The five qcut groups are close in size because quantile binning targets similar record counts.
The five-bin code is technically coherent, but it does not satisfy the requested three labels. The fix is small; the important part is noticing the mismatch before submission.
For account age, the brief asks for five equal-width bins. The notebook instead defines six business-style intervals:
bins = [0, 365, 730, 1095, 1825, 3650, np.inf]
labels = [
    "<1 yr", "1-2 yrs", "2-3 yrs",
    "3-5 yrs", "5-10 yrs", "10+ yrs",
]

merged["account_age_days_category"] = pd.cut(
    merged["account_age_days"],
    bins=bins,
    labels=labels,
)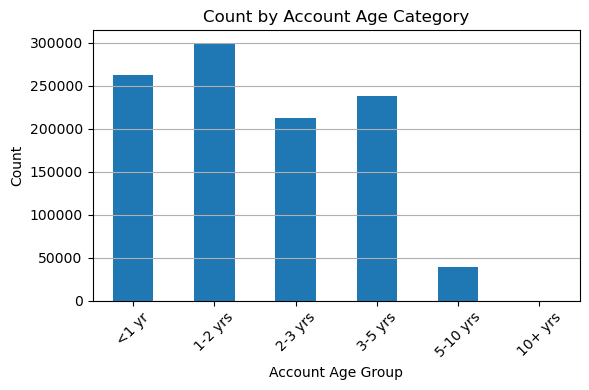
Figure 4. Most transactions fall within the first five account years; the supplied data has no observations in the 10-plus-year group.
The custom intervals are easier for a reader to interpret than anonymous equal-width bins, but they are not the requested five-bin calculation. There is also a boundary issue: with the default settings, a first boundary of 0 excludes account-age values equal to zero. In this dataset, 4,576 same-day transactions receive a missing age category. Adding include_lowest=True would include them.
An assignment-aligned five-bin version is simply:
merged["account_age_days_category"] = pd.cut(
    merged["account_age_days"],
    bins=5,
    include_lowest=True,
)
The choice between equal-width ranges and human-readable business ranges should come from the requirement, not from whichever function call is easiest to remember.
What the notebook does well
The project shows several signs of deliberate work rather than a chain of unexplained commands:
- it records the raw table shapes before transformations;
- it converts both dates before deriving time features;
- it keeps the full transaction row count through two left joins;
- it compares the amount sum and mean balance before and after merging;
- it creates visual checks for skew, account age, and category sizes;
- it exports the final merged data without the index;
- it keeps markdown explanations beside the main stages of the code.
That validation work is the most valuable part of the notebook. A merge that runs without an exception is not automatically correct. Comparing row counts and aggregates gives the result an evidence trail.
What should be revised before submission
The remaining work is specific and manageable:
- Show unique-value counts and duplicate totals before cleaning.
- Convert
district_nameandregionto uppercase. - Use the district mean-imputation rule requested by the brief, or obtain approval for the
-999policy. - Explain that three sparse transaction columns were dropped instead of filled.
- Add the requested district
describe()and histogram-based outlier review. - Report the 40 accounts with unmatched district ID 77 and decide how to handle them.
- If the brief requires it, drop or otherwise resolve the incomplete
account_districtrows and record the effect on transactions. - Change the amount feature from five numeric quantiles to three named quantiles.
- Change the account-age feature to five equal-width bins, or document approval for the six custom ranges.
- Add
include_lowest=Trueif the custom age boundaries are retained. - Print a final missing-value summary for the merged DataFrame rather than only the reduced transaction table.
This is not a reason to discard the notebook. It is the normal difference between a working first pass and a rubric-aligned final submission.
What students can learn from this project
The main lesson is that data cleaning is not a search-and-replace exercise. Every transformation changes the meaning, availability, or comparability of the data.
A good pandas submission should let another person answer five questions:
- What did the raw files contain?
- What changed during cleaning?
- Why was each rule chosen?
- What did the merge preserve or fail to match?
- Which checks support the final result?
The code may use familiar methods (isna, fillna, drop, merge, qcut, and cut), but the grade-worthy work is the reasoning around them. If the sticking point is choosing or explaining those pandas operations, our Pandas homework help page covers the relevant support.
Common questions about this pandas cleaning workflow
Why use a left join for the transaction merge?
A left join keeps every transaction even when account or district details are unavailable. That makes missing matches visible instead of silently removing transaction records. The analyst must still count and resolve the unmatched rows.
Does an unchanged row count prove that a merge is correct?
No. It proves that the transaction rows were preserved in this case. It does not prove that every account received district attributes or that the join keys have the intended relationship.
Should missing numeric values always be filled with the mean?
No. Mean imputation is one classroom-friendly rule, but it reduces variation and may be inappropriate for skewed fields. The correct method depends on the brief, the meaning of the column, and the later analysis.
What is the difference between pd.qcut and pd.cut?
qcut divides observations by rank so the groups have roughly similar counts. cut divides the numeric range into specified or equal-width intervals. They solve different categorization problems.
Why is -999 risky as a missing-value marker?
It is easy to identify, but many calculations treat it as a real number. Unless the code excludes the sentinel, it can pull means downward, create artificial outliers, and distort charts or models.
Is this exact notebook ready to submit?
Not yet. The main workflow runs and the merge validation is useful, but several cleaning rules and bin definitions differ from the supplied requirement. The revision list above identifies the changes needed for closer rubric alignment.
Expert and source note
This walkthrough was prepared from the supplied assignment brief, three raw CSV files, and the completed Jupyter Notebook. The technical review checked the saved notebook outputs and independently audited the supplied CSV keys, missing values, duplicates, dates, joins, and category counts. No student identity or private course information is included.
Students working on similar data-analysis assignments can also visit our data science homework help page for support with cleaning, merging, visualization, and validation.
Stuck on a Python assignment? We ship working code with a walkthrough.